Statistical Monitoring
αlpha includes what is probably the widest, most advanced and comprehensive features for monitoring and improving the performance of your screening program.
For example, with alpha you can :-
- Identify and correct any drift in the normal median values of the screening markers
- Obtain estimates of the expected screening performance given the age distribution of your population; you can then compare this with the screening performance observed in practice
- Obtain an estimate of the expected number of Down's syndrome term births in the screened population, in the absence of screening and therapeutic abortion; this can be compared with the total number of Down's syndrome pregnancies identified
AutoMonitor
A new feature included in αlpha 8 is AutoMonitor which provides at-a-glance information about the performance of your screening program and highlights areas which may require further. For more information click below.
Report Summary
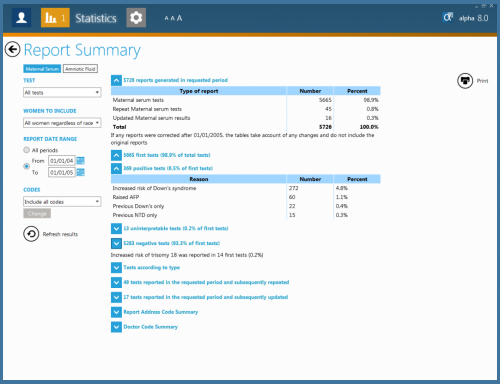
This option helps you to monitor the number of screening and diagnostic tests processed in a specified time period and provides a breakdown of the number of reports according to the screening or diagnostic result. Separate statistical summaries can be produced for first trimester, second trimester and Integrated screening results.
The screen below shows the Report Summary feature in αlpha. It shows the number of tests performed in the specified period and the number and reasons for positive reports.
Median Analysis
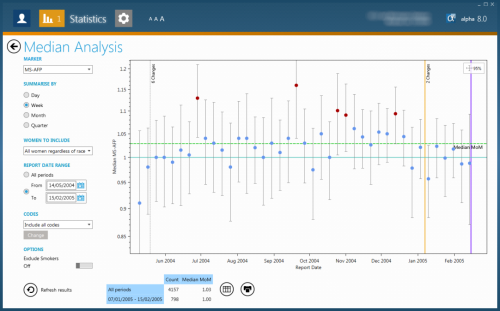
This option provides a graphical indication of median MoM values from month to month so that long term trends and fluctuations in marker levels can be monitored.
The screen below shows the Median Analysis feature in αlpha. The median AFP MoM is shown plotted by week and is fairly close to 1.0.
Tabulations of serum markers with gestational age
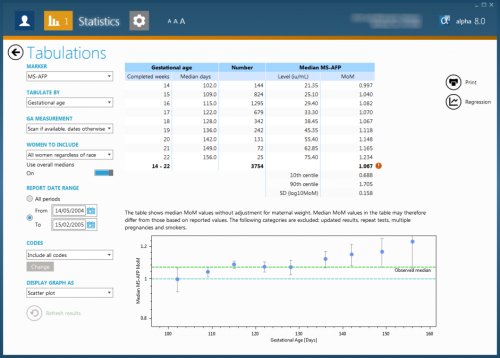
Gestation specific tabulations allow you to evaluate the stability of the medians, and to inspect the change in serum marker levels with increasing gestational age and nuchal translucency with crown rump length.
The screen below shows a tabulation of MS-AFP according to gestational age. The median AFP MoM is 1.067 and is indicated to be outside the 95% confidence intervals around 1.0 MoM suggesting that the normal medians should be updated.
Regressions of tabulated data to determine normal median equations
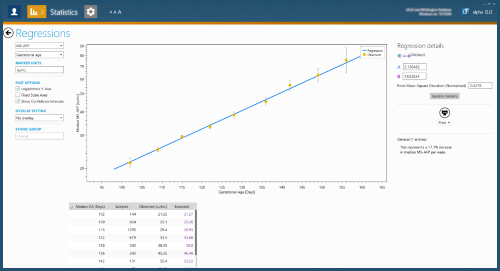
Weighted regressions can be calculated automatically from the tabulated data. αlpha calculates the coefficients for the regression equation which determines the normal median marker level at each gestational age (or crown rump length for nuchal translucency).
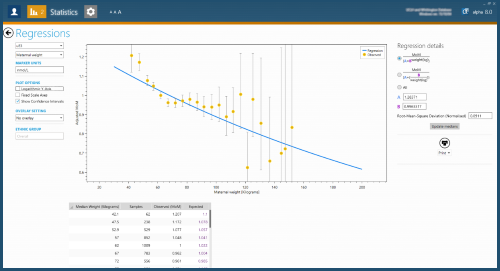
The screen below shows the Regression feature in αlpha. The yellow dots are the measured median AFP values and the blue line is the regression αlpha has fitted to these measurements. The regression equations can be updated from this screen.
Weight adjustment equations
Tabulations of serum marker MoM value against maternal weight can also be be made in order to derive weight adjustment equations. The weighted regression can be calculated automatically from the tabulated data.
The screen below shows the Regression feature in αlpha used to determine the weight adjustment equations. The yellow dots are the measurement MoM values and the blue line is the regression equation αlpha has fitted to these measurements. The weight adjustment equations can be updated from this screen.
Expected Screening Performance
One of αlpha's special features is the facility to estimate expected screening performance in terms of Detection Rate and False Positive Rate, based on the age distribution of the user's own screened population. This can be compared with the observed performance to monitor the screening programme. αlpha can be used to determine the expected screening performance for Down's syndrome, pre-eclampsia, trisomy 18, trisomy 13 and SLOS for any combination of screening markers. It can also be used to examine screening performance in different age groups or based on the age distribution of pregnancies in England and Wales.
αlpha can calculate the screening performance in terms of:
- The Detection Rate and False Positive Rate for a range of fixed risk cut-offs
- The Detection Rate for a range of fixed false positive rates
- The False Positive Rate for a range of fixed detection rates
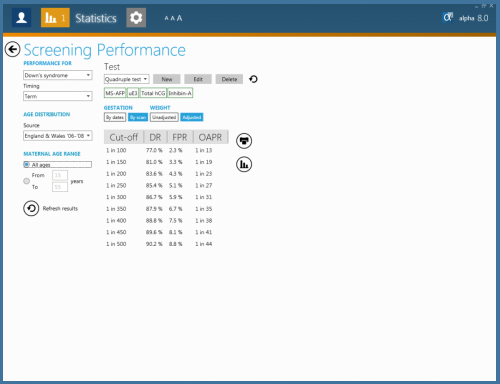
The screen below shows the Screening Peformance calculated by αlpha for the quadruple test (AFP, uE3, hCG and inhibin-A) for the age distribution of maternities in England & Wales in 2006-2008. The Detection Rate (DR), False Positive Rate (FPR) and Odds of being Affected given a Positive Result (OAPR) are calculated for a range of risk cut-off values.
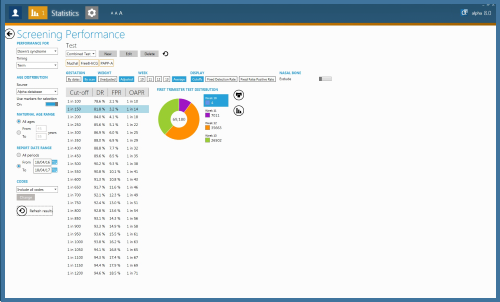
The screen below shows the Screening Peformance calculated by αlpha for the Combined Test (NT, freeß hCG and PAPP-A) for the age distribution of maternities in the user's screening program. The detection rate, false positive rate and odds of being affected given a positive result are calculated for a range of risk cut-off values.
Population
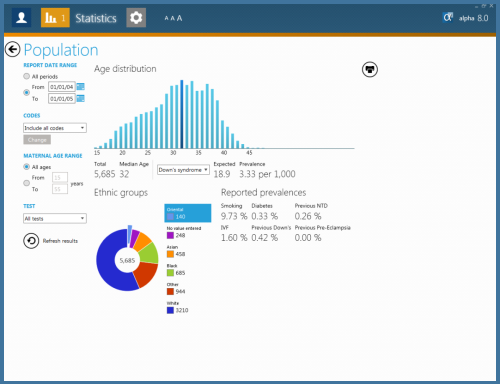
αlpha can also show the age distribution of your screened population together with useful information such as the expected prevelance of Down's syndrome, pre-eclampsia, trisomy 18, trisomy 13 and SLOS in the population.
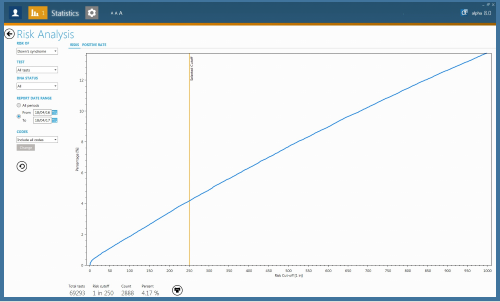
Risk Analysis Plot
αlpha includes an option to interactively select the risk cut-off required so that a specified percentage of the screened population have a risk above that cut-off.
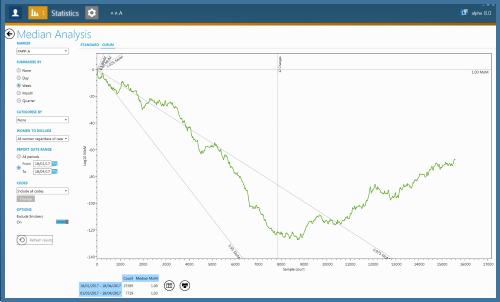
Cumulative Sum (CUSUM) Plots
αlpha includes an option to show Cumulative Sum (CUSUM) plots of marker MoM values. This provides a sensitive way of monitoring marker MoM values and any deviation from 1.0.
Other features
αlpha includes options to show plots of standard positive rate by month and plots of MoMs with confidence interval by smoking status, diabetes status and ethnicity.